Submitted by Lance Roberts via RealInvestmentAdvice.com,
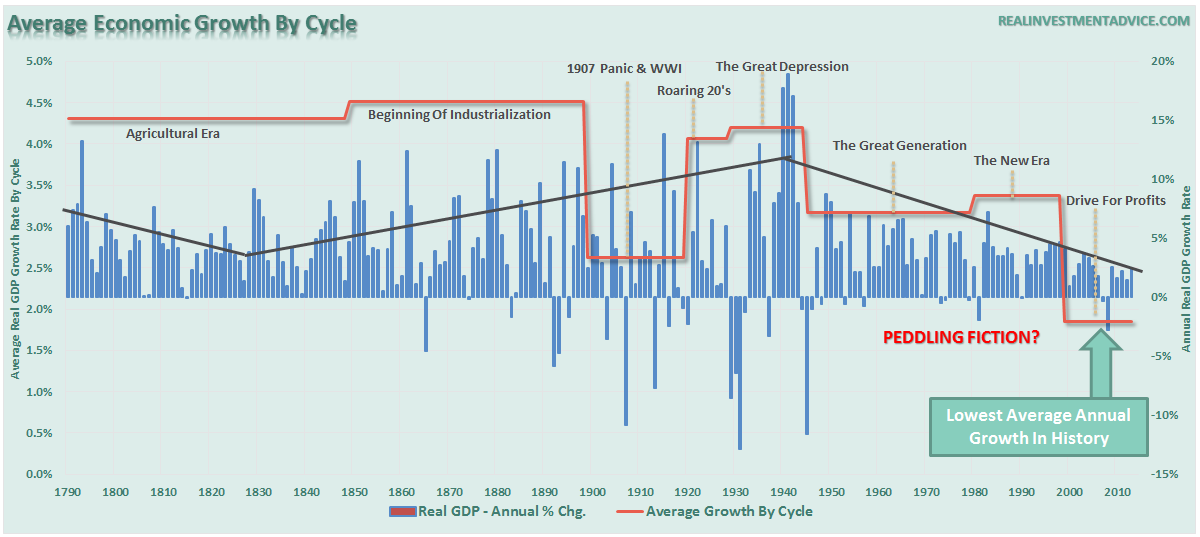
Peddling Fiction
On Tuesday, as I watched the President’s State of the Union Address, the President made the following statement.
“Anyone claiming that America’s economy is in decline is peddling fiction.”
While I certainly understand the need to put a positive spin on the current economic backdrop during your last SOTU address, there is a good bit of misstatement in that comment.
The President is correct when he stated that the impact of technology on wage growth and jobs was not a recent development. It is, in fact, an impact that has been occurring since the 1980’s as shown in the chart below.
While the big driver of the decline in economic growth since the 1980’s has been a structural change from a manufacturing based economy (high multiplier effect) to a service based one (low multiplier effect), it has been exacerbated by the increase in household debt to offset the reduction in wage growth to maintain the standard of living. This is shown clearly in the chart below.
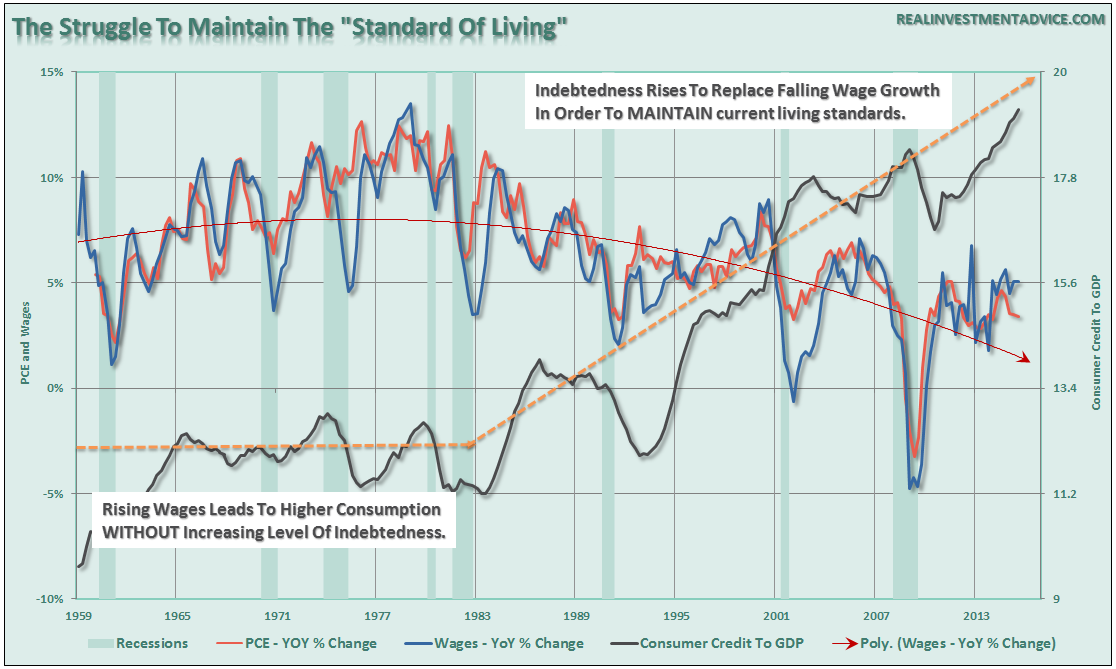
The problem for the President is that while sound-bytes of optimism certainly play well with the media, the average American is well aware of their current plight of the lack of wage growth, inability to save and rising costs of living.
The decline of economic growth is, unfortunately, a reality and an inevitable outcome of decades of deficit spending and debt accumulation. Can it be reversed? I honestly don’t know, but Japan has been trapped in this cycle for 30-years and has yet to find a solution.
Here’s Real Fiction – Low Oil Prices
Over the last couple of years, economists from Wall Street, to the Federal Reserve, to the White House have repeatedly made the following statement:
“Falling oil prices are great for the consumer as it gives them more money to spend.”
I have written many times over the past couple of years, as oil prices fell, that such was not actually the case. To wit:
“The argument is that lower oil prices lead to lower gasoline prices that give consumers more money to spend. The argument seems to be entirely logical since we know that roughly 80% of households in America effectively live paycheck-to-paycheck meaning they will spend, rather than save, any extra disposable income.
The problem is that the economy is a ZERO-SUM game and gasoline prices are an excellent example of the mainstream fallacy of lower oil prices.
Example:
- Gasoline Prices Fall By $1.00 Per Gallon
- Consumer Fills Up A 16 Gallon Tank Saving $16 (+16)
- Gas Station Revenue Falls By $16 For The Transaction (-16)
- End Economic Result = $0
Now, the argument is that the $16 saved by the consumer will be spent elsewhere. This is the equivalent of ‘rearranging deck chairs on the Titanic.'”
Increased consumer spending is a function of increases in INCOME, not SAVINGS. Consumers only have a finite amount of money to spend and whatever “savings” there may be at the pump, it gets quickly absorbed by rising costs of living – like health care.
Most importantly, the biggest reason that falling oil prices are a drag on economic growth, as opposed to the incremental “savings” to consumers, is the decline in output by energy-related sectors.
Oil and gas production makes up a hefty chunk of the “mining and manufacturing” component of the employment rolls. Since 2000, when the oil price boom gained traction, Texas comprised more than 40% of all jobs in the country according to first quarter data from the Dallas Federal Reserve.
The obvious ramification of the plunge in oil prices is eventual loss of revenue leads to cuts in production, declines in capital expenditure plans (which comprises almost 1/4th of all CapEx expenditures in the S&P 500), freezes and/or reductions in employment, and declines in revenue and profitability.
The issue of job loss is critically important. Since the financial crisis the bulk of the jobs “created” have been in lower wage paying areas such as retail, healthcare and other service sectors of the economy. Conversely, the jobs created within the energy space are some of the highest wage paying opportunities available in engineering, technology, accounting, legal, etc. In fact, each job created in energy-related areas has had a “ripple effect” of creating 2.8 jobs elsewhere in the economy from piping to coatings, trucking and transportation, restaurants and retail.
Simply put, lower oil and gasoline prices may have a bigger detraction on the economy than the “savings” provided to consumers.
Why do I remind you of this basic economic reality – because it only took the Federal Reserve 18-months to figure it out. In a recent speech San Fran Fed president John Williams actually admitted the truth.
“The Fed got it wrong when it predicted a drop in oil prices would be a big boon for the economy. It turned out the world had changed; the US has a lot of jobs connected to the oil industry.”
Markets Crash When Oversold
Earlier this week, I discussed the oversold nature of the market and the likely of a “bounce” to “sell into.”
“With all of the alarm bells currently triggering, the initial ‘emotionally’ driven response is most likely an urge to go look at your portfolio statement and start pushing the ‘sell’ button. Don’t Do It!
On a short-term basis, prices oscillate back and forth like a rubber band be pulled and let loose. Physics state that a rubber band stretched in one direction, will initially travel an equal distance in the opposite direction when released.
Take a look at the chart below.”
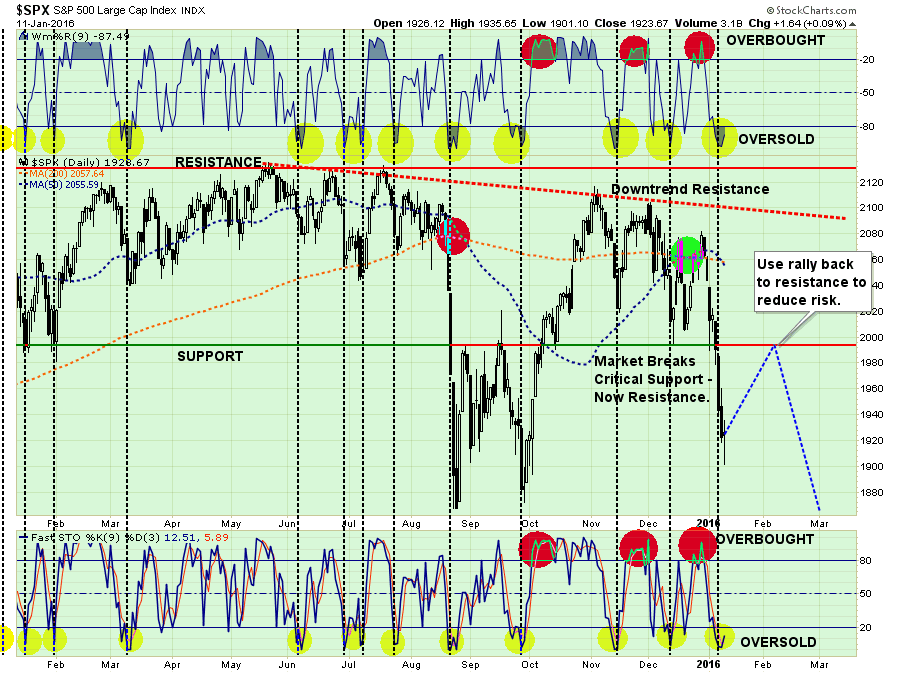
“In particular note the top and bottom portions of the chart. These two indicators measure the ‘over-bought’ and ‘over-sold’ conditions of the market. As with the rubber band example above, you will notice that when these indicators get stretched to the downside, there is an effective ‘snap back’ in fairly short order.
With the markets having issued multiple sell signals, broken very important support and both technical and fundamental deterioration in progress, it is suggested that investors use these ‘snap back’ rallies to reduce equity risk in portfolios.”
I reiterate this point because the market continued to slide on Wednesday which led to several comments about the inability of the markets to get a sellable bounce. There is an important “truism” to remember.
“Markets crash when they’re oversold.”
Let’s step back and take a look at the past two major bull markets and subsequent bear market declines.

(Note: I am using weekly data to smooth volatility)
The top section of the chart is a basic “overbought / oversold” indicator with extreme levels of “oversold” conditions circled. The shaded area on the main part of the chart represents 2-standard deviations of price movement above and below the short-term moving average.
There a couple of very important things to take away from this chart. When markets begin a “bear market” cycle [which is identified by a moving average crossover (red circles) combined with a MACD sell-signal (lower part of chart)], the market remains in an oversold condition for extended periods (yellow highlighted areas.)
More importantly, during these corrective cycles, market rallies fail to reach higher levels than the previous rally as the negative trend is reinforced. All of these conditions currently exist.
Does this mean that the markets will go straight down 20% without a bounce? Anything is possible. However, history suggests that even during bear market cycles investors should be patient and allow rallies to occur before making adjustments to portfolio risk. More often than not, it will keep you from panic selling a short-term market bottom.

No comments:
Post a Comment